Where to find return loads in Europe: the freight balance map explained
Where to find return loads in Europe: how to read Logifie's freight balance map, built from Eurostat 2024 and 2025 data, with region values and limits.

Logifie Team
Logistics Technology Experts
The easiest places to find a return load in Europe are regions that send out more freight than they receive, such as Región de Murcia (249 tonnes loaded for every 100 unloaded) and Andalucía (198), while many capital regions and most Swiss regions sit at the hard end. Logifie's freight balance map, built from Eurostat road freight data for 2024 and 2025, shows this for most European regions, against a background in which about 20% of EU road freight vehicle-km were driven empty in 2020 . This post explains what the number means, how to read the seven verdicts, how the data is built, where it stops being reliable, and how to open the interactive freight balance map .
Where do trucks find a load back in Europe?
Trucks find a load back most easily in regions where more freight leaves than arrives, and that balance changes from region to region inside a single country. A dispatcher who knows only that "Spain is easy" or "Switzerland is hard" misses most of the picture. Murcia and Madrid are both in Spain, yet their numbers sit far apart.
Most public tools stop at country level. The TIMOCOM Transport Barometer compares freight offers with vehicle space on the TIMOCOM exchange for Europe and for routes between and within countries. The Trans.eu Freight Radar lists the top five transport directions per country, with load counts and spot rates, across 35 active countries. Both are useful for market mood. Neither breaks a country into regions.
The reason this matters is empty running. Eurostat reported that about one fifth of EU road freight vehicle-km were empty in 2020, with national haulage at 24% and international haulage at 13% ( Eurostat news, published 2021-12-10 ). Those are 2020 figures, and the spread between countries was wide: trans.info reported Cyprus at 44% and Belgium at 6% from the same Eurostat data. For the background on why trucks run empty and what it costs, learn what empty running is in road freight and see what empty miles cost .
What does "loaded per 100 unloaded" mean for a return load?
Each region on the map carries one number: the international road freight tonnes loaded there for every 100 tonnes unloaded there. Below 100, more freight arrives than leaves, so a truck that delivers in that region has a harder time finding a load back. Above 100, more freight leaves than arrives, and reloading is easier.
Two examples from the data show the scale. Región de Murcia (ES62) received 2,929 thousand tonnes and sent out 7,287 thousand tonnes over 2024 and 2025 combined, which gives 249. Pest (HU12) received 6,351 thousand tonnes and sent out 2,085 thousand tonnes, which gives 33. A truck delivering into Pest is entering a region where about three times as many tonnes arrive as leave.
The number counts tonnes, not trucks. A region dominated by heavy bulk goods can look easier than its truck traffic would suggest, because few vehicles move many tonnes. Treat the figure as a signal about direction of freight flow, not as a count of loads waiting for you.
Why does the map remove domestic haulage?
The map removes domestic hauls carried out by a region's own country's hauliers, so the number reflects cross-border freight and freight moved by foreign trucks. With domestic freight left in, almost every region looks balanced, because local trucks move goods in both directions all day. A foreign HGV can only reach a small part of that work, under the cabotage limits below, so it would tell you little about your own return leg.
Why does cabotage still count?
Cabotage still counts because it is a real reload for a foreign truck. Cabotage means a carrier from one Member State carrying goods between two points inside another Member State. Under Article 8(2) of Regulation (EC) No 1072/2009 , a carrier may do up to three cabotage operations after an incoming international carriage, and the last unloading must happen within 7 days of the last unloading of that incoming carriage.
Regulation (EU) 2020/1055 added Article 8(2a): the same vehicle may not do cabotage in the same Member State within 4 days after the end of its cabotage operation there. That rule applies from 2022-02-21. In practice, a high ratio in a region helps you only as far as these limits allow, so check the rules for your own vehicle before counting on a domestic reload.
How do I read the seven verdicts, from very hard to leave to very easy to reload?
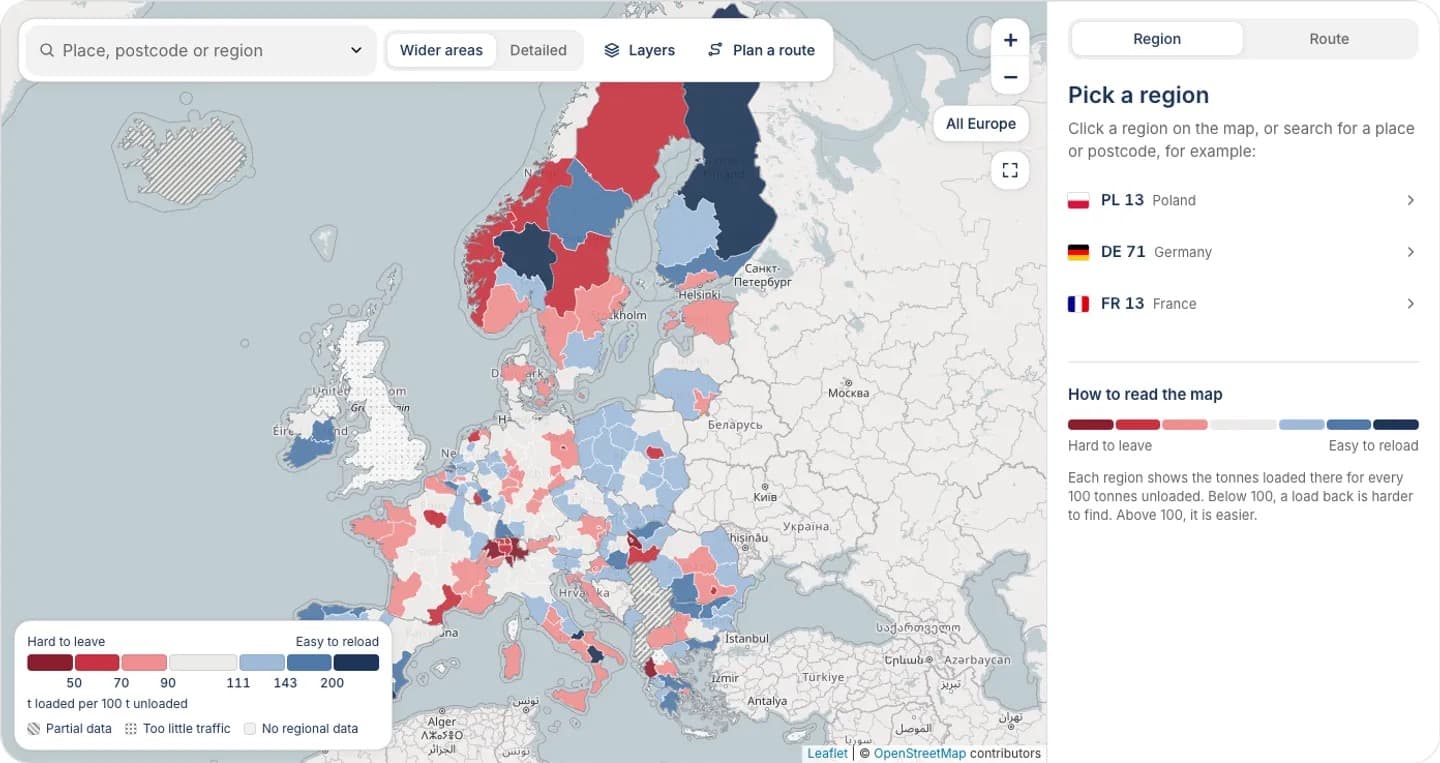
Every region falls into one of seven verdicts, set by fixed ranges of the ratio. The shading on the map runs from red for hard to leave to blue for easy to reload, and the table below shows the ranges and what each one suggests for the return leg.
| Verdict | Ratio range | What it means for the return leg |
|---|---|---|
| Very hard to leave | below 50 | Freight mostly arrives; plan the return leg before you accept the outbound job |
| Hard to leave | 50 to 69 | Freight arrives faster than it departs; expect to search wider for a return load |
| Slightly hard to leave | 70 to 89 | Mild surplus of arrivals; a return load is possible but needs more searching |
| Balanced | 90 to 110 | Arrivals and departures roughly match; no strong pull either way |
| Slightly easy to reload | 111 to 142 | Mild surplus of departures; reloading is somewhat easier than average |
| Easy to reload | 143 to 199 | Freight leaves in clearly larger volumes than it arrives |
| Very easy to reload | 200 and up | Strong surplus of departures; check the confidence badge before relying on it |
The map also shows three extra states. "Partial data" marks countries where only part of the freight is counted. "Too little traffic to judge" marks regions below a volume floor. "No regional data" marks places the dataset does not cover. None of these is a verdict, and none should be read as "balanced".
A verdict describes the past two years of freight flow, not the state of the market on a given day. It does not promise a load on a given day, and it does not turn tonnes into empty kilometres, waiting days or rates.
Which regions are hardest to leave, and which are easiest to reload?
Among the regions in the table, the hardest to leave are Swiss and Hungarian regions, Algarve and several capital regions. The easiest to reload include Región de Murcia, Andalucía and Zeeland. The table is a selection, not a ranking. The table shows selected NUTS-2 regions for 2024 and 2025 combined, with the ratio of tonnes loaded per 100 tonnes unloaded. NUTS-2 is the EU's classification for medium-sized regions, which the map labels "wider areas".
| Region | Country | Loaded per 100 unloaded | Verdict | Confidence |
|---|---|---|---|---|
| Pest | HU | 33 | Very hard to leave | steady |
| Espace Mittelland | CH | 38 | Very hard to leave | steady |
| Ticino | CH | 41 | Very hard to leave | steady |
| Algarve | PT | 41 | Very hard to leave | mixed |
| Bucureşti-Ilfov | RO | 52 | Hard to leave | steady |
| Berlin | DE | 64 | Hard to leave | steady |
| Ile de France | FR | 67 | Hard to leave | steady |
| Zuid-Holland | NL | 131 | Slightly easy to reload | steady |
| Düsseldorf | DE | 134 | Slightly easy to reload | steady |
| Prov. Hainaut | BE | 149 | Easy to reload | steady |
| Zeeland | NL | 192 | Easy to reload | steady |
| Andalucía | ES | 198 | Easy to reload | steady |
| Región de Murcia | ES | 249 | Very easy to reload | steady |
Most capital regions sit on the hard side. Budapest (52), Bucureşti-Ilfov (52), Berlin (64), Ile de France (67), Comunidad de Madrid (74) and Wien (75) all sit below balance, which fits the idea that cities receive more freight than they send out. Eastern and Midland in Ireland (167) is a counter-example, so check each region. Most other Swiss regions follow the Espace Mittelland and Ticino pattern.
On the easy side, the picture mixes size and surplus. Zuid-Holland unloaded 39,627 thousand tonnes and loaded 51,785 thousand tonnes over the two years, so a ratio of 131 there rests on very large volumes. Región de Murcia has a much higher ratio on far smaller volumes, which is why the confidence badge and the volumes behind a number matter as much as the number itself.
How is the map built, and what can it not tell you?
The map is Logifie's freight balance map, built from Eurostat data. It is a Logifie indicator made from public statistics and is not an official Eurostat ranking.
What data sits behind the numbers?
The inputs are Eurostat's road freight tables for 2024 and 2025, published under CC BY 4.0. The tables `road_go_ta_rl` and `road_go_ta_ru` give freight loaded and unloaded per region, and the domestic tables `road_go_na_rl3g` and `road_go_na_ru3g` supply the domestic haulage that is subtracted. Eurostat last updated these tables on 2026-10-06, and the Logifie dataset was built on 2026-11-06.
Eurostat's road freight metadata , last updated 2026-07-22, explains the regional detail. Loading and unloading places are coded to NUTS level 3 in EEA countries and Switzerland, international trips have had full regional coding across the EEA since 2008, and national authorities re-code place names or postcodes to NUTS-3. The map shows both levels: NUTS-2 as wider areas and NUTS-3 as detailed areas. This post quotes NUTS-2 values only.
Where does the map stop being reliable?
The limits are specific, and each one changes how you should read a region.
- Tonnes, not trucks or trips. Heavy-goods regions look easier than their vehicle traffic would suggest.
- Small regions are noisy. Regions below a volume floor show "Too little traffic to judge". A few small regions that pass the floor still show ratios above 250 on a small base, so read the confidence badge before trusting an extreme value.
- The UK has no regional data. It appears as "No regional data".
- Some countries are partial. For Turkey, Serbia, Albania, Malta and Iceland, only freight moved by EU, Swiss and Norwegian hauliers is counted.
- Greek postcodes cannot be searched by prefix. Search a Greek place name instead.
The confidence badge compares the two years. "Steady" means the two years agree closely, "mixed" means they differ somewhat, and "unsteady" means they differ a lot. Algarve shows 41 with a "mixed" badge, so treat the value as approximate because the two years differ somewhat.
How do I use the route check before accepting a load?
Use the route check before you accept an outbound job, to see how easy it will be to leave the delivery region. Enter the stops, read the verdict for each pickup and note where the route ends. A route that ends in a "Very hard to leave" or "Hard to leave" region is a prompt to line up a return load before you commit.
The interactive tool has four parts:
- Search. Look up a place, a postcode or a region. Postcode areas appear when you zoom in.
- Route check. Add up to 8 pickup and delivery stops. The tool shows straight-line distances between stops, which are not road kilometres and not a basis for a price, plus the verdict at each pickup and at the end of the route.
- Rankings. "Hardest regions to leave" and "Easiest regions to reload" list the extremes.
- Table and CSV. A filterable table of all regions can be downloaded as a CSV file.
When a route looks workable, use the "Get a quote for this route" link to request a quote for this route . Once you know where a return load is likely, see how to price and book a backhaul .
How do I get the TikTok access code for the interactive map?
The page text on the freight balance page is open to everyone, including the explanation of the numbers, the FAQ and the sources. The interactive map, search, route check, rankings and region table open with a 6-character access code that Logifie publishes in its TikTok videos. The numbers quoted in this post need no code.
To get a code, press the "Get a code on TikTok" button on the page, which leads to the Logifie TikTok account , and find a code in the videos. Enter it in the box shown in place of the map. The code opens the tool in your browser until the code expires, and after that you need a new one.
Frequently asked questions
What is a good ratio for finding a return load?
A ratio of 111 or more is where the map shows a surplus of departures. The 90 to 110 range is balanced and shows no strong pull either way. Treat the verdict as a signal about where freight tends to flow, not as a measure of your own chances.
Does a high number guarantee a load back?
No. The number describes tonnes moved over 2024 and 2025, not the freight on offer today. Your vehicle type, timing and the cabotage limits all affect whether a load is available to you.
Is this an official Eurostat ranking?
No. Eurostat publishes the underlying road freight tables, and Logifie calculates the ratio and the verdicts from them. The map is a Logifie indicator built from public data.
Why are domestic hauls left out of the ratio?
Domestic hauls by a region's own country's hauliers would make nearly every region look balanced. Removing them leaves cross-border freight and freight moved by foreign trucks, including cabotage. That is the freight a foreign truck can realistically compete for.
Does the map cover every country?
Not fully. The UK has no regional data, and Turkey, Serbia, Albania, Malta and Iceland are partial because only EU, Swiss and Norwegian hauliers are counted. Very small regions show "Too little traffic to judge".
Do I need the code to see the region numbers?
Not for the values quoted in this post. The full region table, search, route check and rankings need the 6-character code from Logifie TikTok videos.
Check your next route on the freight balance map (access code needed) before you accept the outbound load, and plan the return leg while you still have a choice.

