Is it easy to find return loads in the Netherlands and Belgium? Zeeland and Hainaut lead, the ports do not
Return loads in the Netherlands and Belgium: Zeeland (192) and Hainaut (149) are easiest, Friesland (60) and Vlaams-Brabant (75) hardest (Eurostat 2024-25).

Logifie Team
Logistics Technology Experts
Reloading in the Netherlands and Belgium is balanced overall (Netherlands about 109, Belgium about 106 tonnes loaded per 100 unloaded) and easiest in Zeeland (192) and Hainaut (149). Data: Eurostat road freight tables for 2024 and 2025, turned into regional ratios in Logifie's freight balance map, checked 2026-11-19.
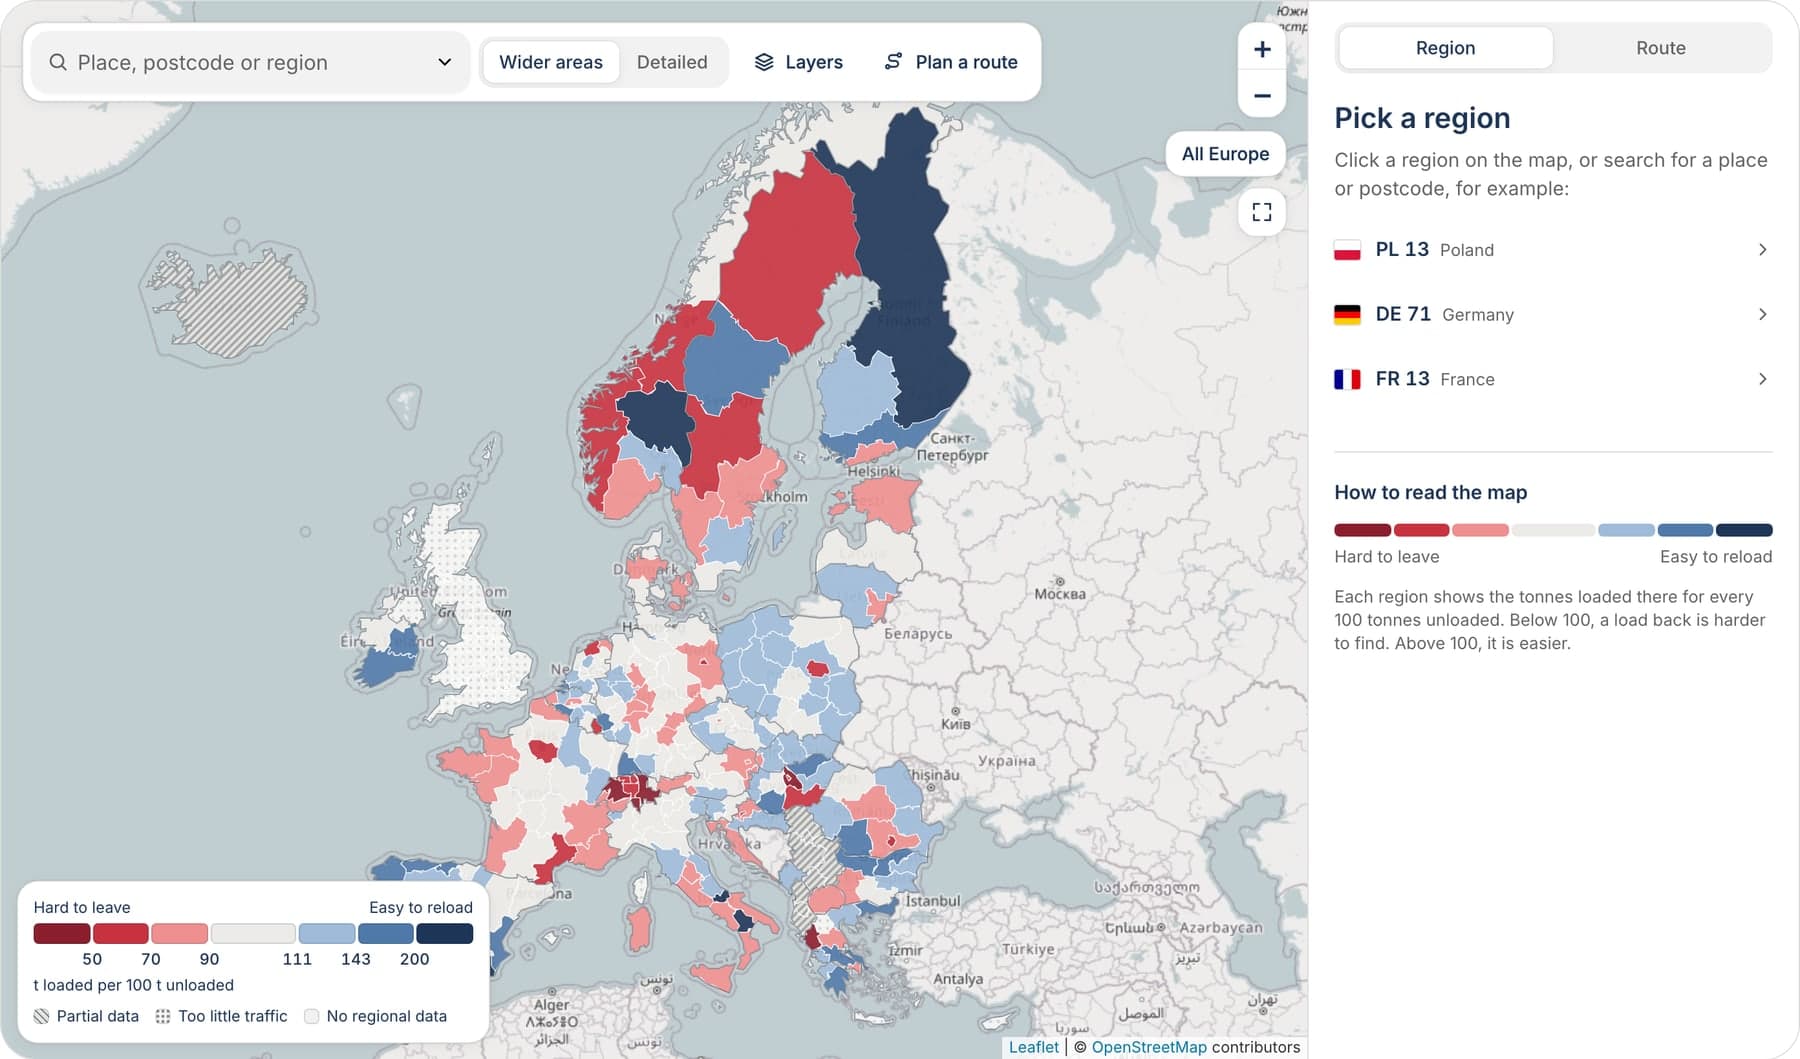
Is it easy to reload in the Netherlands and Belgium?
For most regions, yes. Of the 12 Dutch and 11 Belgian NUTS-2 regions (the EU's mid-sized statistical regions), only Zeeland and Hainaut reach the easy band (143 to 199). Seven more are slightly easy (111 to 142), nine are balanced, three are slightly hard and two are hard to leave, as the freight balance map shows.
| Region (NUTS-2) | Loaded per 100 unloaded, 2024 and 2025 | Verdict |
|---|---|---|
| Zeeland (NL) | 192 | Easy to reload |
| Hainaut (BE) | 149 | Easy to reload |
| Zuid-Holland (NL) | 131 | Slightly easy to reload |
| Prov. Antwerpen (BE) | 113 | Slightly easy to reload |
| West-Vlaanderen (BE) | 83 | Slightly hard to leave |
| Groningen (NL) | 78 | Slightly hard to leave |
| Vlaams-Brabant (BE) | 75 | Slightly hard to leave |
| Friesland (NL) | 60 | Hard to leave |
The capital regions are covered in why trucks leave capital cities empty , so each gets one line here: Brussels-Capital 56, Luxembourg 68 (the country is a single region) and Noord-Holland, home of Amsterdam, 100.
Are Rotterdam and Antwerp easier to reload than inland regions?
Only slightly, and neither is at the top. Rotterdam sits in Zuid-Holland (131) and Antwerp in Prov. Antwerpen (113). Zeeland (192) and Hainaut (149) both score higher. Each value covers international road freight across the whole region, never the port alone, and sea throughput is not part of it.
Which regions are hardest to leave, and how far can you trust the values?
Outside the capital regions, Friesland (60) is the only Dutch or Belgian region in the hard to leave band. It unloaded 5,390 thousand tonnes and loaded 3,240 thousand over 2024 and 2025. The three slightly hard regions are Vlaams-Brabant (75), Groningen (78) and West-Vlaanderen (83).
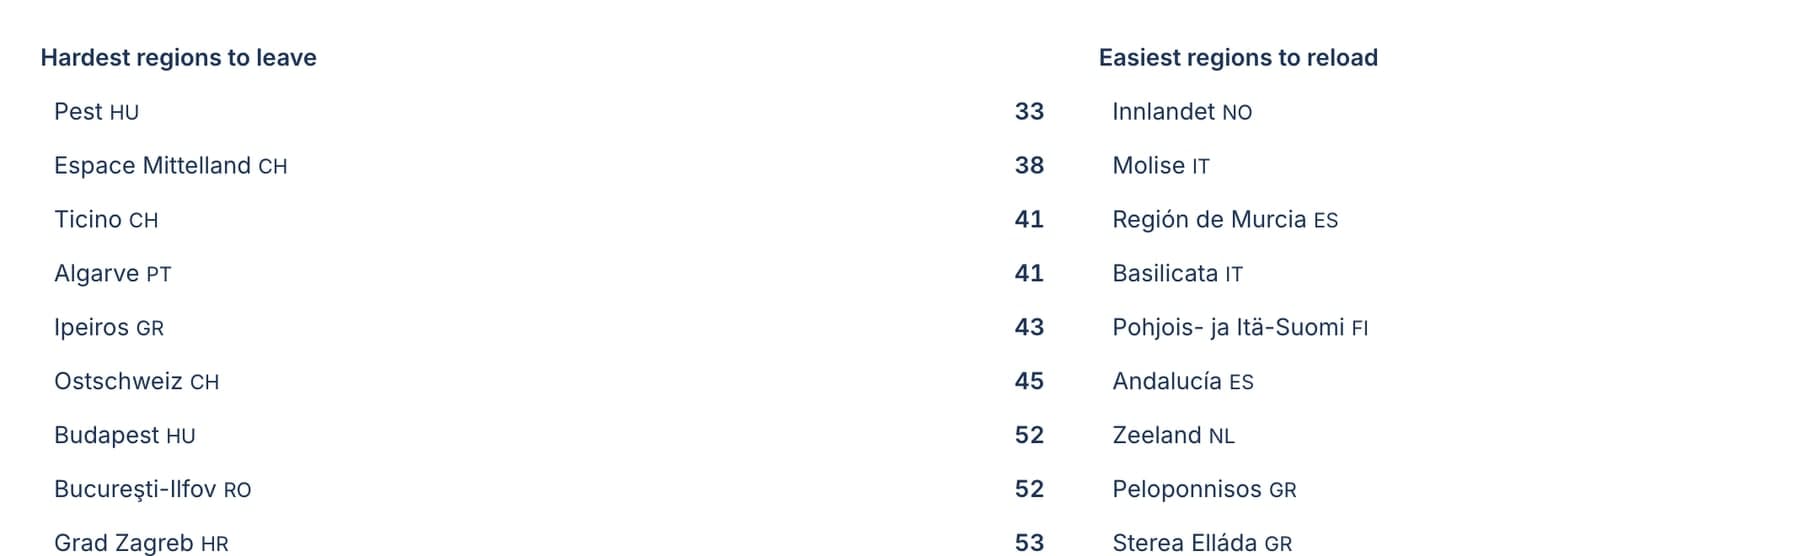
Each figure divides the international tonnes picked up in a region by the tonnes delivered there and multiplies by 100, using Eurostat tables last updated on 2026-10-06 ( Eurostat road freight metadata ). Domestic hauls by each country's own hauliers are removed. Cabotage, meaning loads a foreign truck moves between two points within another country, counts as a reload: a foreign haulier may run up to 3 such operations within 7 days of an international delivery, then wait 4 days before more there ( European Commission, checked 2026-11-19 ).
These ratios weigh cargo, not truck traffic, so bulk-heavy regions score higher than their trucks suggest, and low-volume regions swing between years. The badge shows how far 2024 and 2025 agree: Zeeland, Zuid-Holland and Hainaut are steady, Prov. Antwerpen is mixed. Treat the figures as Logifie's reading of public Eurostat tables. For the wider picture, read the freight balance map overview , then plan the return load before accepting the job .
Frequently asked questions
Is it hard to find a return load from the Netherlands?
Ten of 12 Dutch regions are balanced or better on the 2024 and 2025 data. Groningen (78) is slightly hard to leave and Friesland (60) is hard to leave.
Is Belgium easier than the Netherlands for reloading?
Not at national level. On Eurostat 2024 and 2025 data summed by Logifie across regions, Belgium is about 106 and the Netherlands about 109, both balanced. The spread sits inside each country, from Hainaut 149 to Vlaams-Brabant 75 and from Zeeland 192 to Friesland 60.
Is it easy to reload around the port of Rotterdam or Antwerp?
It is slightly easy in both regions that contain them: Zuid-Holland scores 131 and Prov. Antwerpen 113 on the 2024 and 2025 data. Prov. Antwerpen has a mixed badge, so the two years disagreed.
What does "loaded per 100 unloaded" mean for a truck?
It compares international tonnes picked up in a region with tonnes delivered there. Over 2024 and 2025 Zeeland received 7,728 thousand tonnes and sent out 14,857 thousand, a ratio of 192 per 100. The ratio is in tonnes, so it does not translate into kilometres, days or rates.
Running a Dutch or Belgian route? Request a freight quote for your Netherlands or Belgium run .

